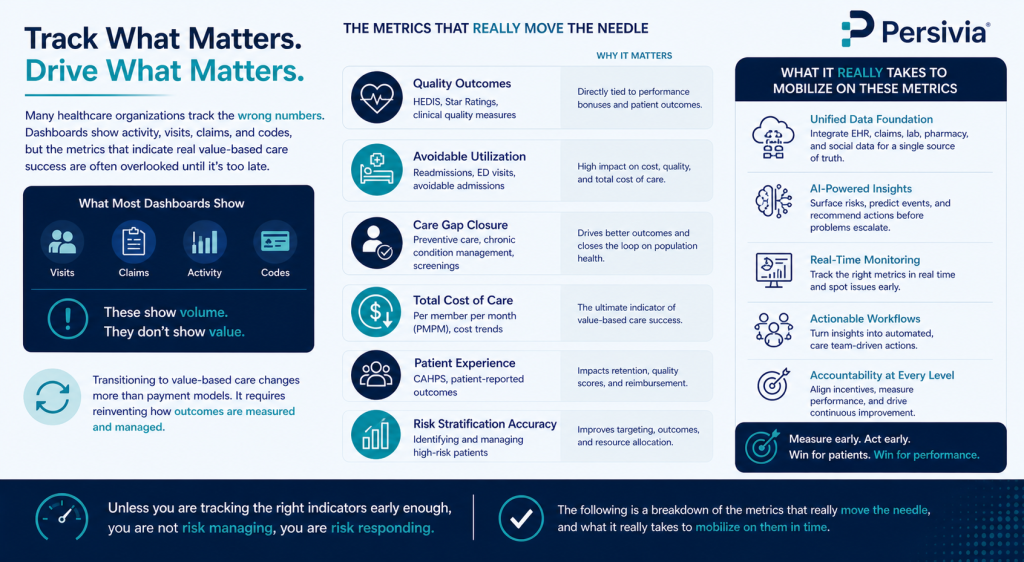
Many healthcare organizations track the wrong numbers. Dashboards show activity, visits, claims, and codes, but the metrics that indicate real value-based care success are often overlooked until it’s too late.”
Transitioning to value-based care changes more than payment models. It requires reinventing how outcomes are measured and managed. And unless you are observing the correct indicators early enough, you are not risk managing, you are risk responding. The following is a breakdown of the metrics that really move the needle, and what it really takes to mobilize on them in time.
What Does “Predictive” Really Mean in Value-Based Care?
Not all metrics are created equal. Some tell you what already happened. Others tell you what’s about to happen.
The best measures of any VBC program are those that provide you with sufficient lead time to take action before a patient becomes a high-cost case. These can be categorized as a few critical.
Risk Stratification Accuracy
Risk scores are not only the way to bill. They can direct care teams to the patients requiring attention at a particular time when properly utilized.
Key indicators to track:
- RAF (Risk Adjustment Factor) score accuracy: Are chronic conditions being documented completely and consistently?
- Hierarchical Condition Category (HCC) capture rate: Missed HCCs mean underestimated risk and underfunded care
- Year-over-year risk score drift: Sudden drops often signal documentation gaps, not actual health improvement
Poor risk stratification is one of the leading reasons ACOs miss savings targets. If your scores don’t reflect actual patient complexity, your care plans won’t either.
The Utilization Metrics That Signal Real Problems
High utilization isn’t always a bad sign, but unplanned utilization almost always is.
Hospital Readmission Rates
A 30-day readmission is one of the clearest signals that a care transition failed. Track it by:
- Condition type (heart failure, pneumonia, and joint replacements are CMS’s primary focus areas)
- Care setting (discharges to home vs. skilled nursing vs. rehab)
- Time-to-follow-up (patients seen within 7 days post-discharge readmit far less often)
ED Utilization for Ambulatory-Sensitive Conditions
Emergency visits for conditions like diabetes, asthma, or hypertension are preventable and expensive. High rates here point directly to gaps in primary and chronic care management.
Quality Metrics That CMS Actually Scores You On
Value-based care success in CMS programs, ACO REACH, MSSP, TEAM, and others, is tied directly to quality performance. Two measurement sets dominate:
| Metric Type | Program | What It Measures |
| HEDIS measures | MSSP / MA | Preventive care, chronic disease management |
| STAR ratings | Medicare Advantage | Member experience, medication adherence |
| Consumer Assessment (CAHPS) | Most VBC programs | Patient-reported care quality |
The organizations that perform best on these aren’t necessarily the ones providing the most care. They’re the ones who systematically close gaps before the measurement period ends.
Care Gap Closure Rate
This is how quickly your team identifies and closes open quality gaps, missed screenings, overdue labs, and unaddressed chronic conditions. A high closure rate correlates directly with better HEDIS and STAR performance.
Factors that affect it:
- How early gaps are flagged in the care year
- Whether alerts reach providers at the point of care
- How well your outreach actually converts to completed actions
The Financial Metrics That Tie It All Together
Clinical outcomes matter. But in value-based contracts, they have to connect to dollars.
- Total Cost of Care (TCOC) per member: The foundational metric for shared savings programs
- Specialist referral patterns: High, uncoordinated specialist use inflates costs without proportional outcomes improvement
- Generic prescribing rate: A simple but consistently impactful cost lever
- Attributed member churn: Losing high-cost members mid-year distorts benchmarks and risk pools
These figures do not exist in isolation. A spike in TCOC can always be considered to have been a result of a break in one of the above metrics of predictive or quality, and thus, the integrated tracking is more important than any individual dashboard.
Why Most Organizations Still Miss the Mark
The ability to access data is no longer the issue. The majority of teams fail to do it fast enough, at the right place of care, which is the most important thing to do.
This is where the value-based performance is won or lost because there is a gap between the awareness that a patient is at high risk and establishing contact with them before a crisis occurs. That requires:
- Real-time population surveillance, not monthly reports
- Alerts embedded in provider workflows, not separate portals
- Personalized outreach based on each patient’s actual profile, not generic reminders
- A platform that connects claims, clinical, and social data in one place
That is exactly why the shift to AI-driven and integrated care management tools has gained even more swiftness, as the metrics will only be important once your team can respond to them promptly.
Bottom Line
Successful VBC programs focus on the right metrics. These include risk scores, readmission rates, care gap closure, and total cost of care, not just reporting exercises. They are the keys that can make your organization save money, achieve better results, and thrive on value-based contracts. The organizations that are moving faster are not doing more; they are measuring smarter and acting faster.
Want To Turn Metrics Into Action?
Persivia provides an AI-first digital health platform designed to meet the needs of value-based care, which is an integration of 160M+ patient records, real-time risk stratification, care gaps alerts, and quality tracking into one connected system. Further, this platform has been crafted to bridge the gap between words and deed, with a predictive risk model to point-of-care provider alerts, when your team is not just tracking metrics, but actively using them to drive faster, better decisions.